Image Processing - Detecting Skittles in Images
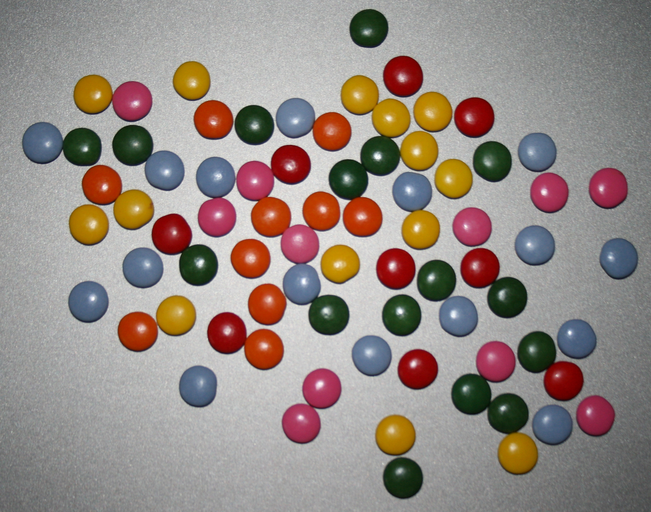
The goal of this short project (one week) was to automatically extract information from images of skittles on desaturated backgrounds. In particular: position, radius and hue of each skittle, as well as grouping and counting skittles based on color.
Example input image
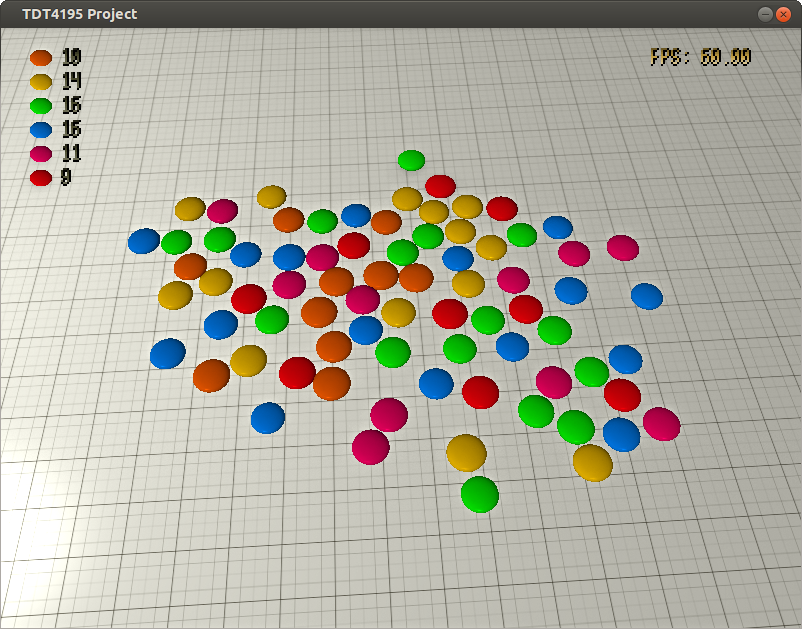
Final detection + visualization
This work done as part of a project in a course at NTNU (university in Trondheim, Norway), which I'm taking for the fun of it. For a video demo, see below in the visualization section.
The code was written using OpenCV,
SDL2. For the graphics framework,
this write-up might be of interest.
1. Object Segmentation
1.1 Saturation Thresholding
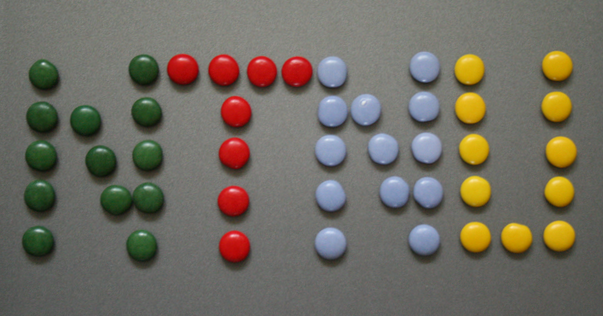
Initial segmentation takes advantage of the assumption that backgrounds are dissaturated, and objects of interest are saturated. The input image is converted to the HSV color space, followed by applying Gaussian blur and binary thresholding to the saturation channel.
Source
HSV hue channel
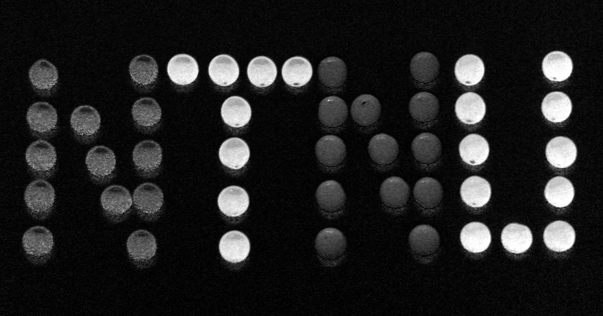
+ blur and threshold

There is some left over clutter from the binary thresholding. This is mitigated using distance transform.
1.2 Distance Transform
Distance transform takes in a binary image and replaces all white pixels with the distance to the closest black pixel. There are many ways to define distances, some which allow for faster algorithms. The most accurate for the application here is the Euclidean distance, which has been used (rather, a good approximation of it).
Distance Transform
![]()
Threshold pass
![]()
By applying a threshold pass (values above threshold are preserved, all lower set to zero) with a "minimum skittle radius allowed", in effect, all blobs with a radius smaller than this value are removed.
Closeup
![]()
The peaks correspond to the skittles' center, and the value is a good estimate for the skittles' radius. The next step is therefore to isolate the peaks (local maxima).
2. Isolating Peaks
Below, the series of operations performed to isolate the local
maxima is shown:
A: Dist.trans.
![]()


3. Determining Skittle Location & Radius
Some skittle configurations cause problems in the segmentation, and is the rationale for the two-phase approach described in this section. Note the false peak in the example below:
Source

Dist.transf.
![]()
Peaks

Determining the peak locations is done by traversing the peak image. Upon hitting a black pixel, and the location is stored. To avoid adjacent hits, surrounding pixels (within a determined radius) are set to white.
1st pass

2nd pass

In the first pass, the radius used is the "minimum allowed skittle radius" (the same as was used before). This radius is shown above in blue circles. The false peak is also included.
The skittle radius corresponding to the peak is found from the distance transform image. By sorting these radii, the median skittle radius is found.
In the second pass, the same traversal is repeated, except now using
4. Determining Skittle Hue
Since we now have all skittle locations and radii, it is possible to extract pixels corresponding to each individual skittle. We do this from the HSV hue channel, and average the hues for each skittle.
It is important to note that hues are circular values, if you will, and
care must be taken when averaging them. Think of the hue as just an angle. Both
5. Hue Clustering
By plotting the individual skittle hues from various input test images, it became clear that this was a fairly robust and accurate way of determining the skittle hues.
The clear clustering allowed a very simple algorithm for clustering the hues:
Polar plot of skittle hues from test image.
Another, more contrived way of clustering the hues, is Jenks Natural Breaks Optimization.
6. Visualization
Visualization is done by rendering skittle-shaped ellipsoid meshes in a virtual scene. The skittles are rendered in the relative positions and sizes as found by the image processing part.
Here is a quick demo:
Table of Contents
Top 1. Object Segmentation 1.1 Saturation Thresholding 1.2 Distance Transform 2. Isolating Peaks 3. Determining Skittle Location & Radius 4. Determining Skittle Hue 5. Hue Clustering 6. Visualization
Tags
License

About
Roald Fernandez
Norwegian software developer
Thinks alpacas are underrated
Newsletter
