Mapping the OEIS Database

1. Overview
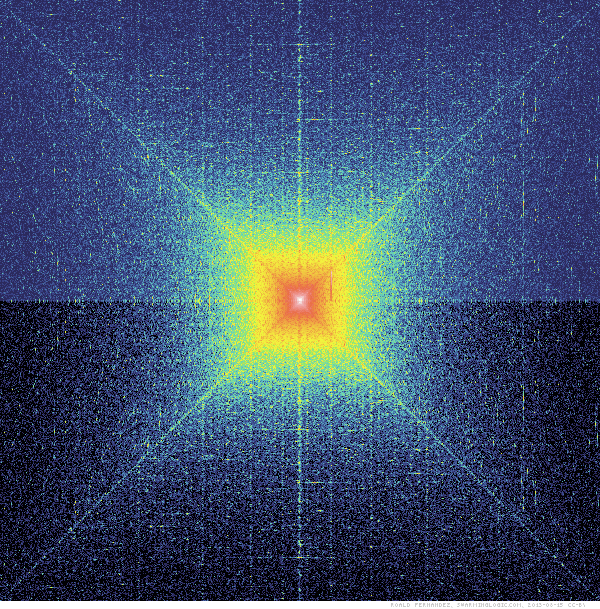
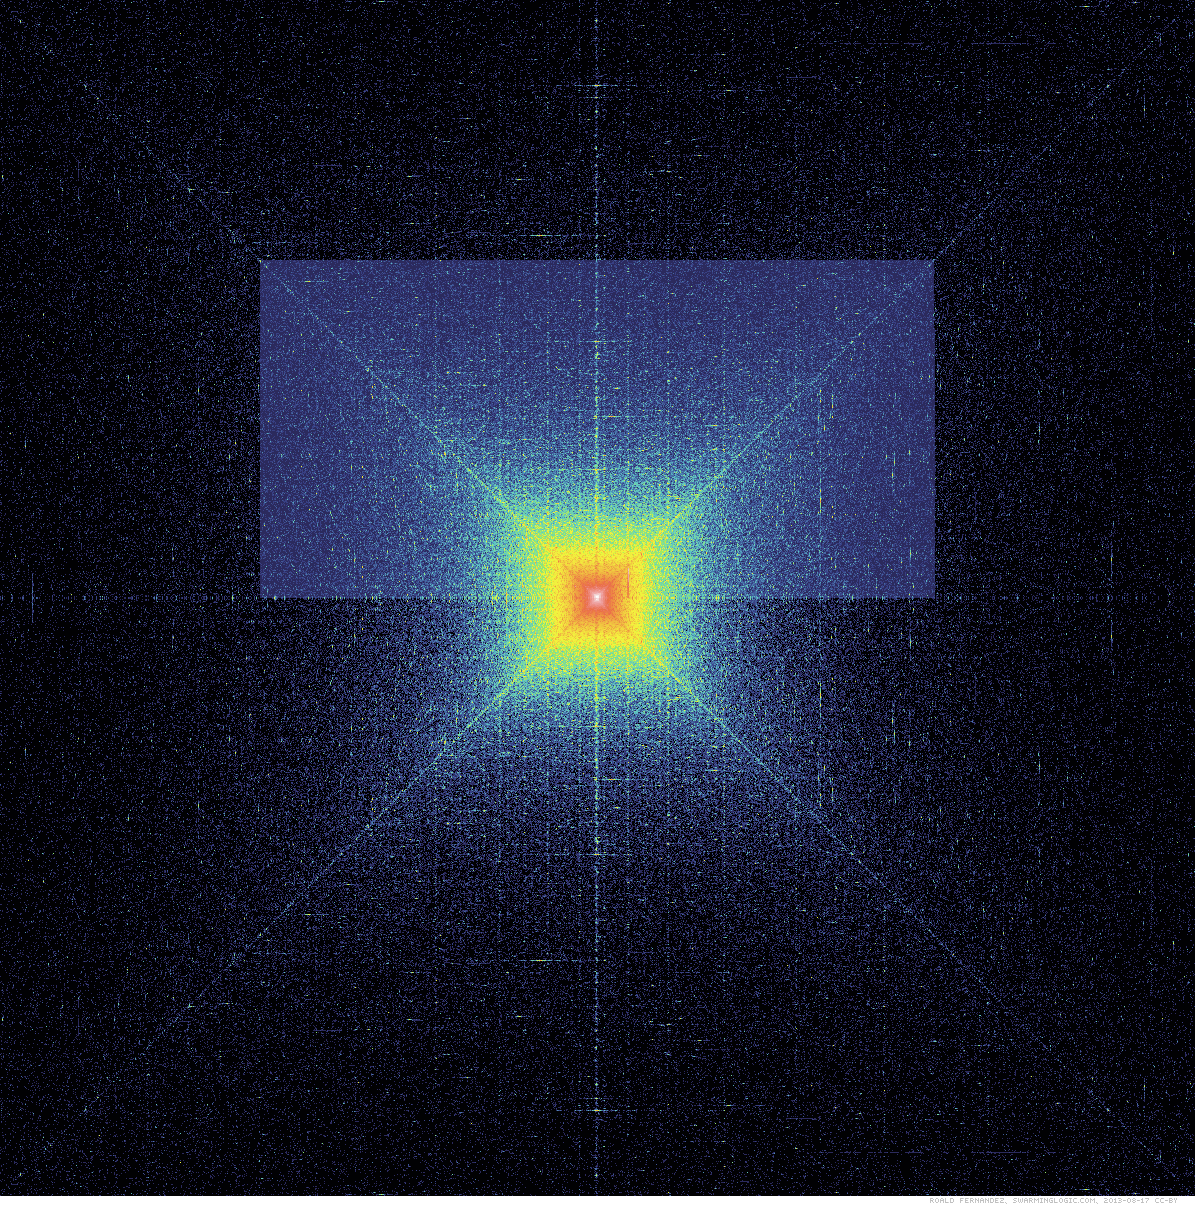
First of all, what is OEIS, and what is the image above? It certainly looks cool!
OEIS is short for The On-Line Encyclopedia of Integer Sequences, and is the go-to database to look up number sequences, and find math papers that talk about it. E.g. the sequence '2, 4, 8, 32', gives 24 results, one of which is $a(n) = 2^{\mathrm{Fibonacci}(n)}$. Good to know!
Q: What happens if you use this database to look up a single integer?
A: It returns all the sequences that contain that number
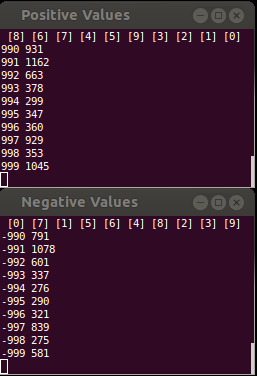
At the time of writing...
In a way, the number of entries for a particular number, is a measure for how interesting the number is.
As preposterous as it sounds to quantify something so subjective, I don't know how else to put it.
Imagine you had access to all the photographs taken by humans (pretend you're the NSA), and you counted all images where an apple was depicted, and counted all images where sharks were depicted. You could, in a sense, use this number as a relative measure for how interesting apples and sharks are (as the object of photography).
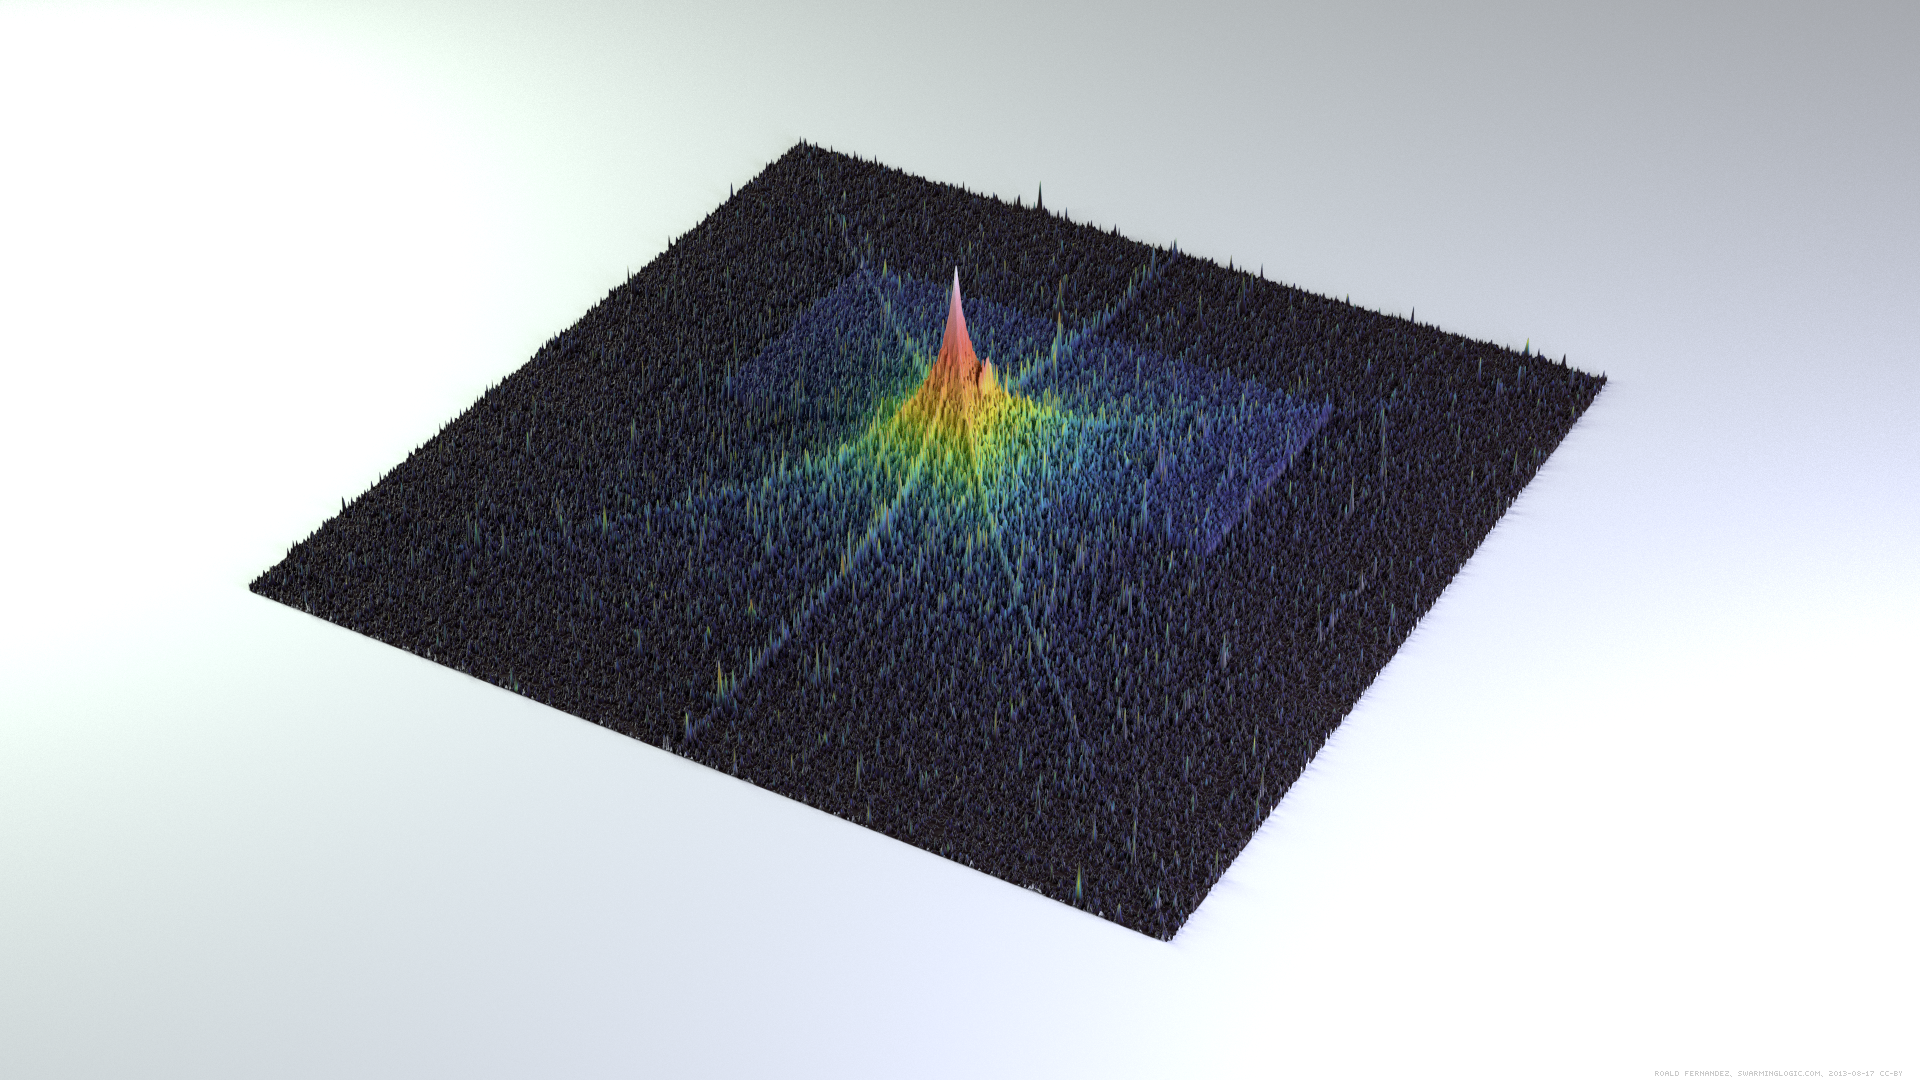
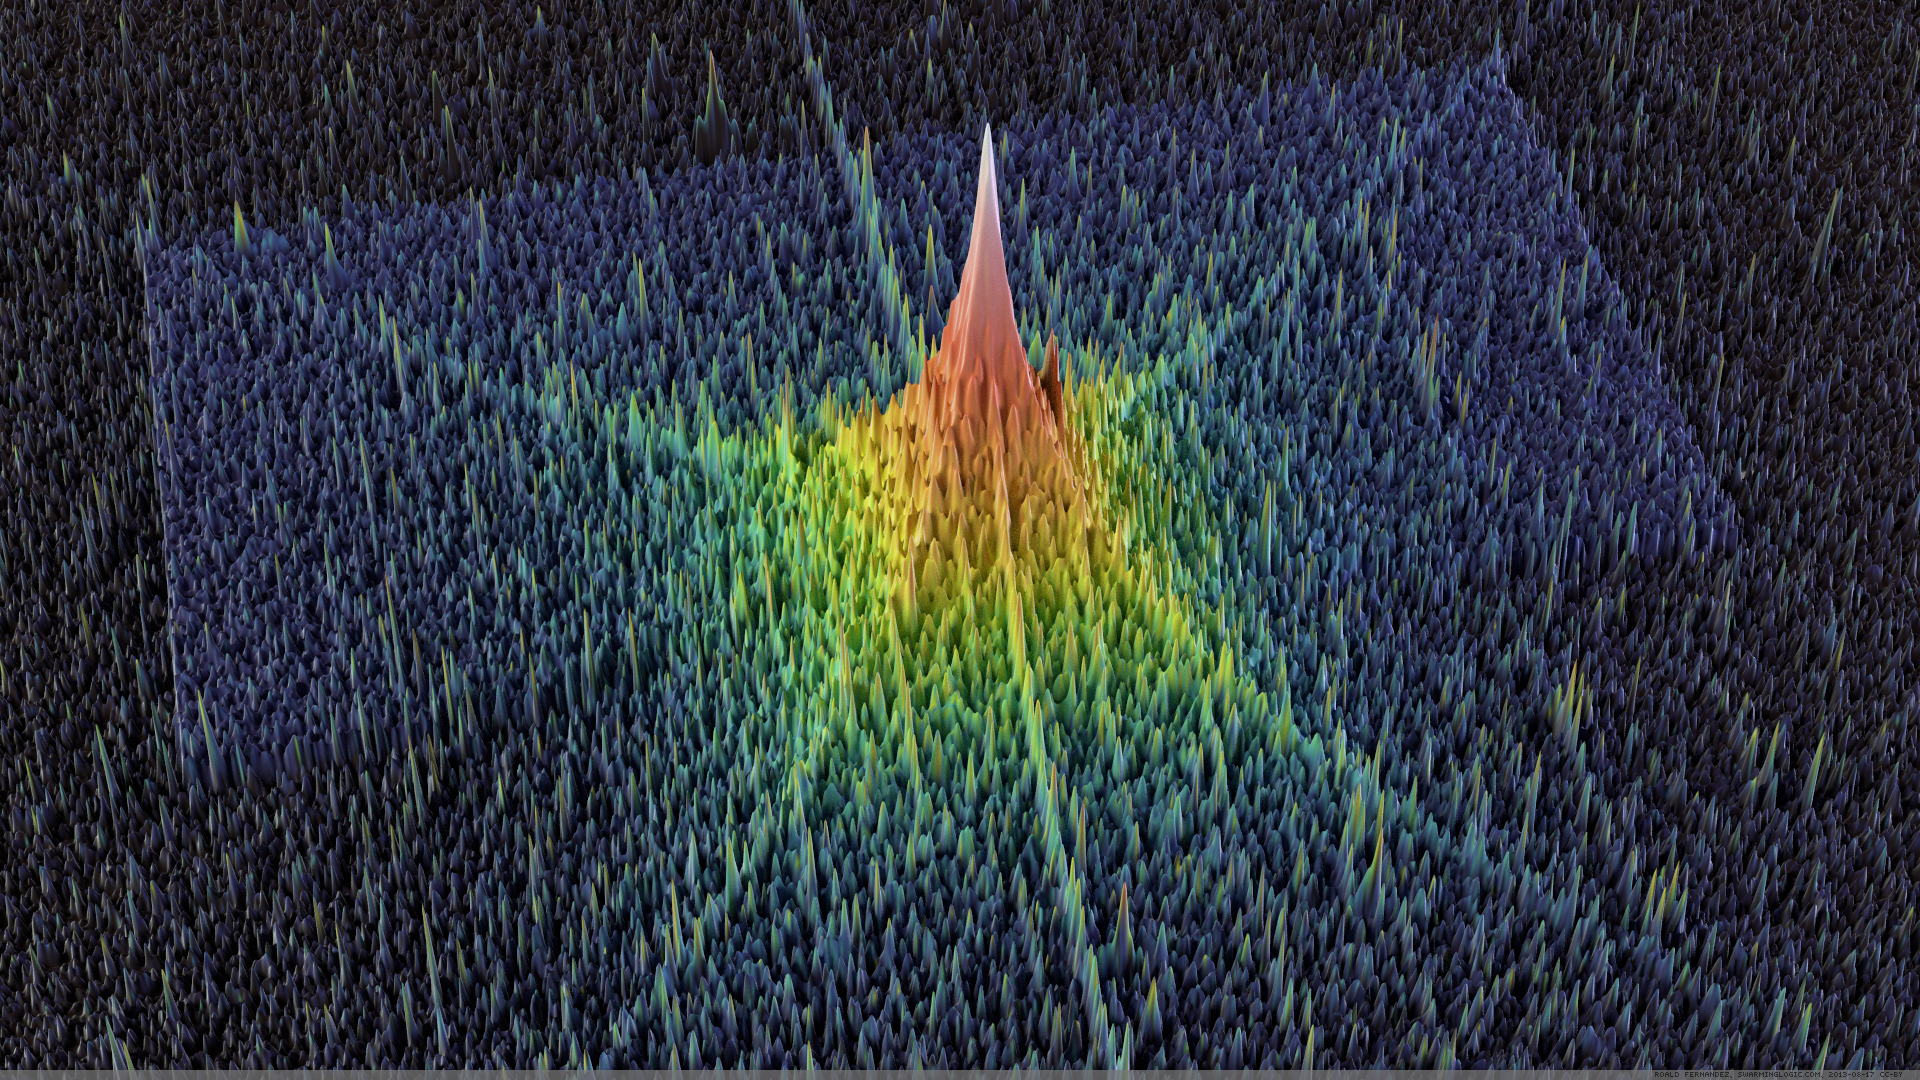
The second question -- the image above? It is a plot of the relative OEIS occurrence frequency, of each integer from -125 000 to +125 000 (not exactly, but close enough). Structured in a snake-like pattern with 0 in the center, positive values growing in the top half, and corresponding negative values mirrored in the lower half (see below).
2. Plotting the Data
Initially I only looked at the positive integers, and had structured them in a spiral, wrapping around itself, clockwise.
Then I considered the negative integers as well, and the only meaningful way to lay out the numbers in a 'spiral like' way, was the the following:
The actual value plotted, $p_i$, for each integer, $x_i$, is:
Using this color ramp to map the values from 0 to 1:
Which was created by linearly interpolating between the following HSL values:
|------+-----+-----+------|
|  Val |   H |   S |    L |
|------+-----+-----+------|
| 0.00 | 241 | 0.3 | 0.0  |
| 0.07 | 241 | 0.4 | 0.33 |
| 0.15 | 209 | 0.4 | 0.5  |
| 0.20 | 169 | 0.5 | 0.6  |
| 0.25 | 125 | 0.6 | 0.72 |
| 0.30 |  65 | 0.9 | 0.6  |
| 0.61 |  14 | 0.8 | 0.6  |
| 0.81 |   0 | 0.7 | 0.8  |
| 1.00 |   0 | 0.4 | 1.0  |
|------+-----+-----+------|
3. Acquiring the Data
The quickest way I know to do this, is writing a bash-script using curl
to get the html page, and unix tools sed and head to extract the value.
| Line 2: | Gets the HTML source for the OEIS page. |
| Line 3: | Extracts all lines containing result or results |
| Line 4: | Ignores all matches except the first. |
| Line 5-7: | Isolates the value of interest. |
| Line 8: | Returns the value, or 0 if no results were found. |
Parallelizing Queries
The goal was to get to a 1000 x 1000 image.
Using the above function in a large for-loop, it would have taken around 50 days.
If running separately for positive and negative values, 25 days.
A better parallelized version was written, and can be found in this github gist , reducing it to a couple of days. Here it is in action:
NB: If you live in the US, think carefully before running such a script. Apparently, making HTTP requests with
modified URLs could be a criminal
offense. </tongueincheek>
4. Creating the Image
The best tool for generating the image would be processing, octave, matlab, gnuplot, or any other language with a library for pixel manipulation in images, or advanced 2D plotting.
I would definitely not recommend my choice: C++ and SDL. But hey, that's what I'm trying to learn these days, so why not? Here is the final image (click for full resolution), with over 1.4 million values from the OEIS database.
I'm also learning Blender, so here you have a 3D plot using the values as a displacement map.
5. Thoughts & Conclusions
There are three things that surprised me about the data:
- The sudden drop in entries for positive values. The first explanation that comes to mind is that the OEIS database itself limits the number of searchable entries for any given sequence. Many sequences like "natural numbers", "even numbers", "odd numbers", would mean that no integers should have zero entries, yet, this is not the case.
-
There is a peak for values ranging from around, let's see *crunches some numbers*
1970, to ...*crunches even more numbers*2013.*facepalm* Apparently I also searched the meta-data, and most sequences have references to findings and papers between
1970-2013.
-
The peaks close to the diagonals and "y-axis". I have no idea why they occur. Ironically, the integer sequences that correspond to the diagonals, are not themselves registered in the database.
The sequence corresponding to "y-axis",
0, 1, 8, 17, 32, 49, is registered as A077221.This means that the sequence corresponding to the diagonal in the first, second, third, and fourth quadrants are ($a_1$, $a_2$, $a_3$, $a_4$, respectively): $$\begin{aligned} a_1(n) & = A_{077221}(n) - (-1)^{n} n \\ a_2(n) & = A_{077221}(n) + (-1)^{n} n \;\;\;\;\;\text{(offset by 1)} \\ a_3(n) & = -a_2(n) \\ a_4(n) & = -a_1(n) \end{aligned}$$
Lastly, I should point out that I didn't do this because I considered it important or valuable. It just seemed like a fun thing to do. I hope you enjoyed.
PS: If there is any interest, I'll upload the raw data.
Table of Contents
Top 1. Overview 2. Plotting the Data 3. Acquiring the Data 4. Creating the Image 5. Thoughts & Conclusions
Tags
linux bash curl math visualization
License

About
Roald Fernandez
Norwegian software developer
Thinks alpacas are underrated
Newsletter
